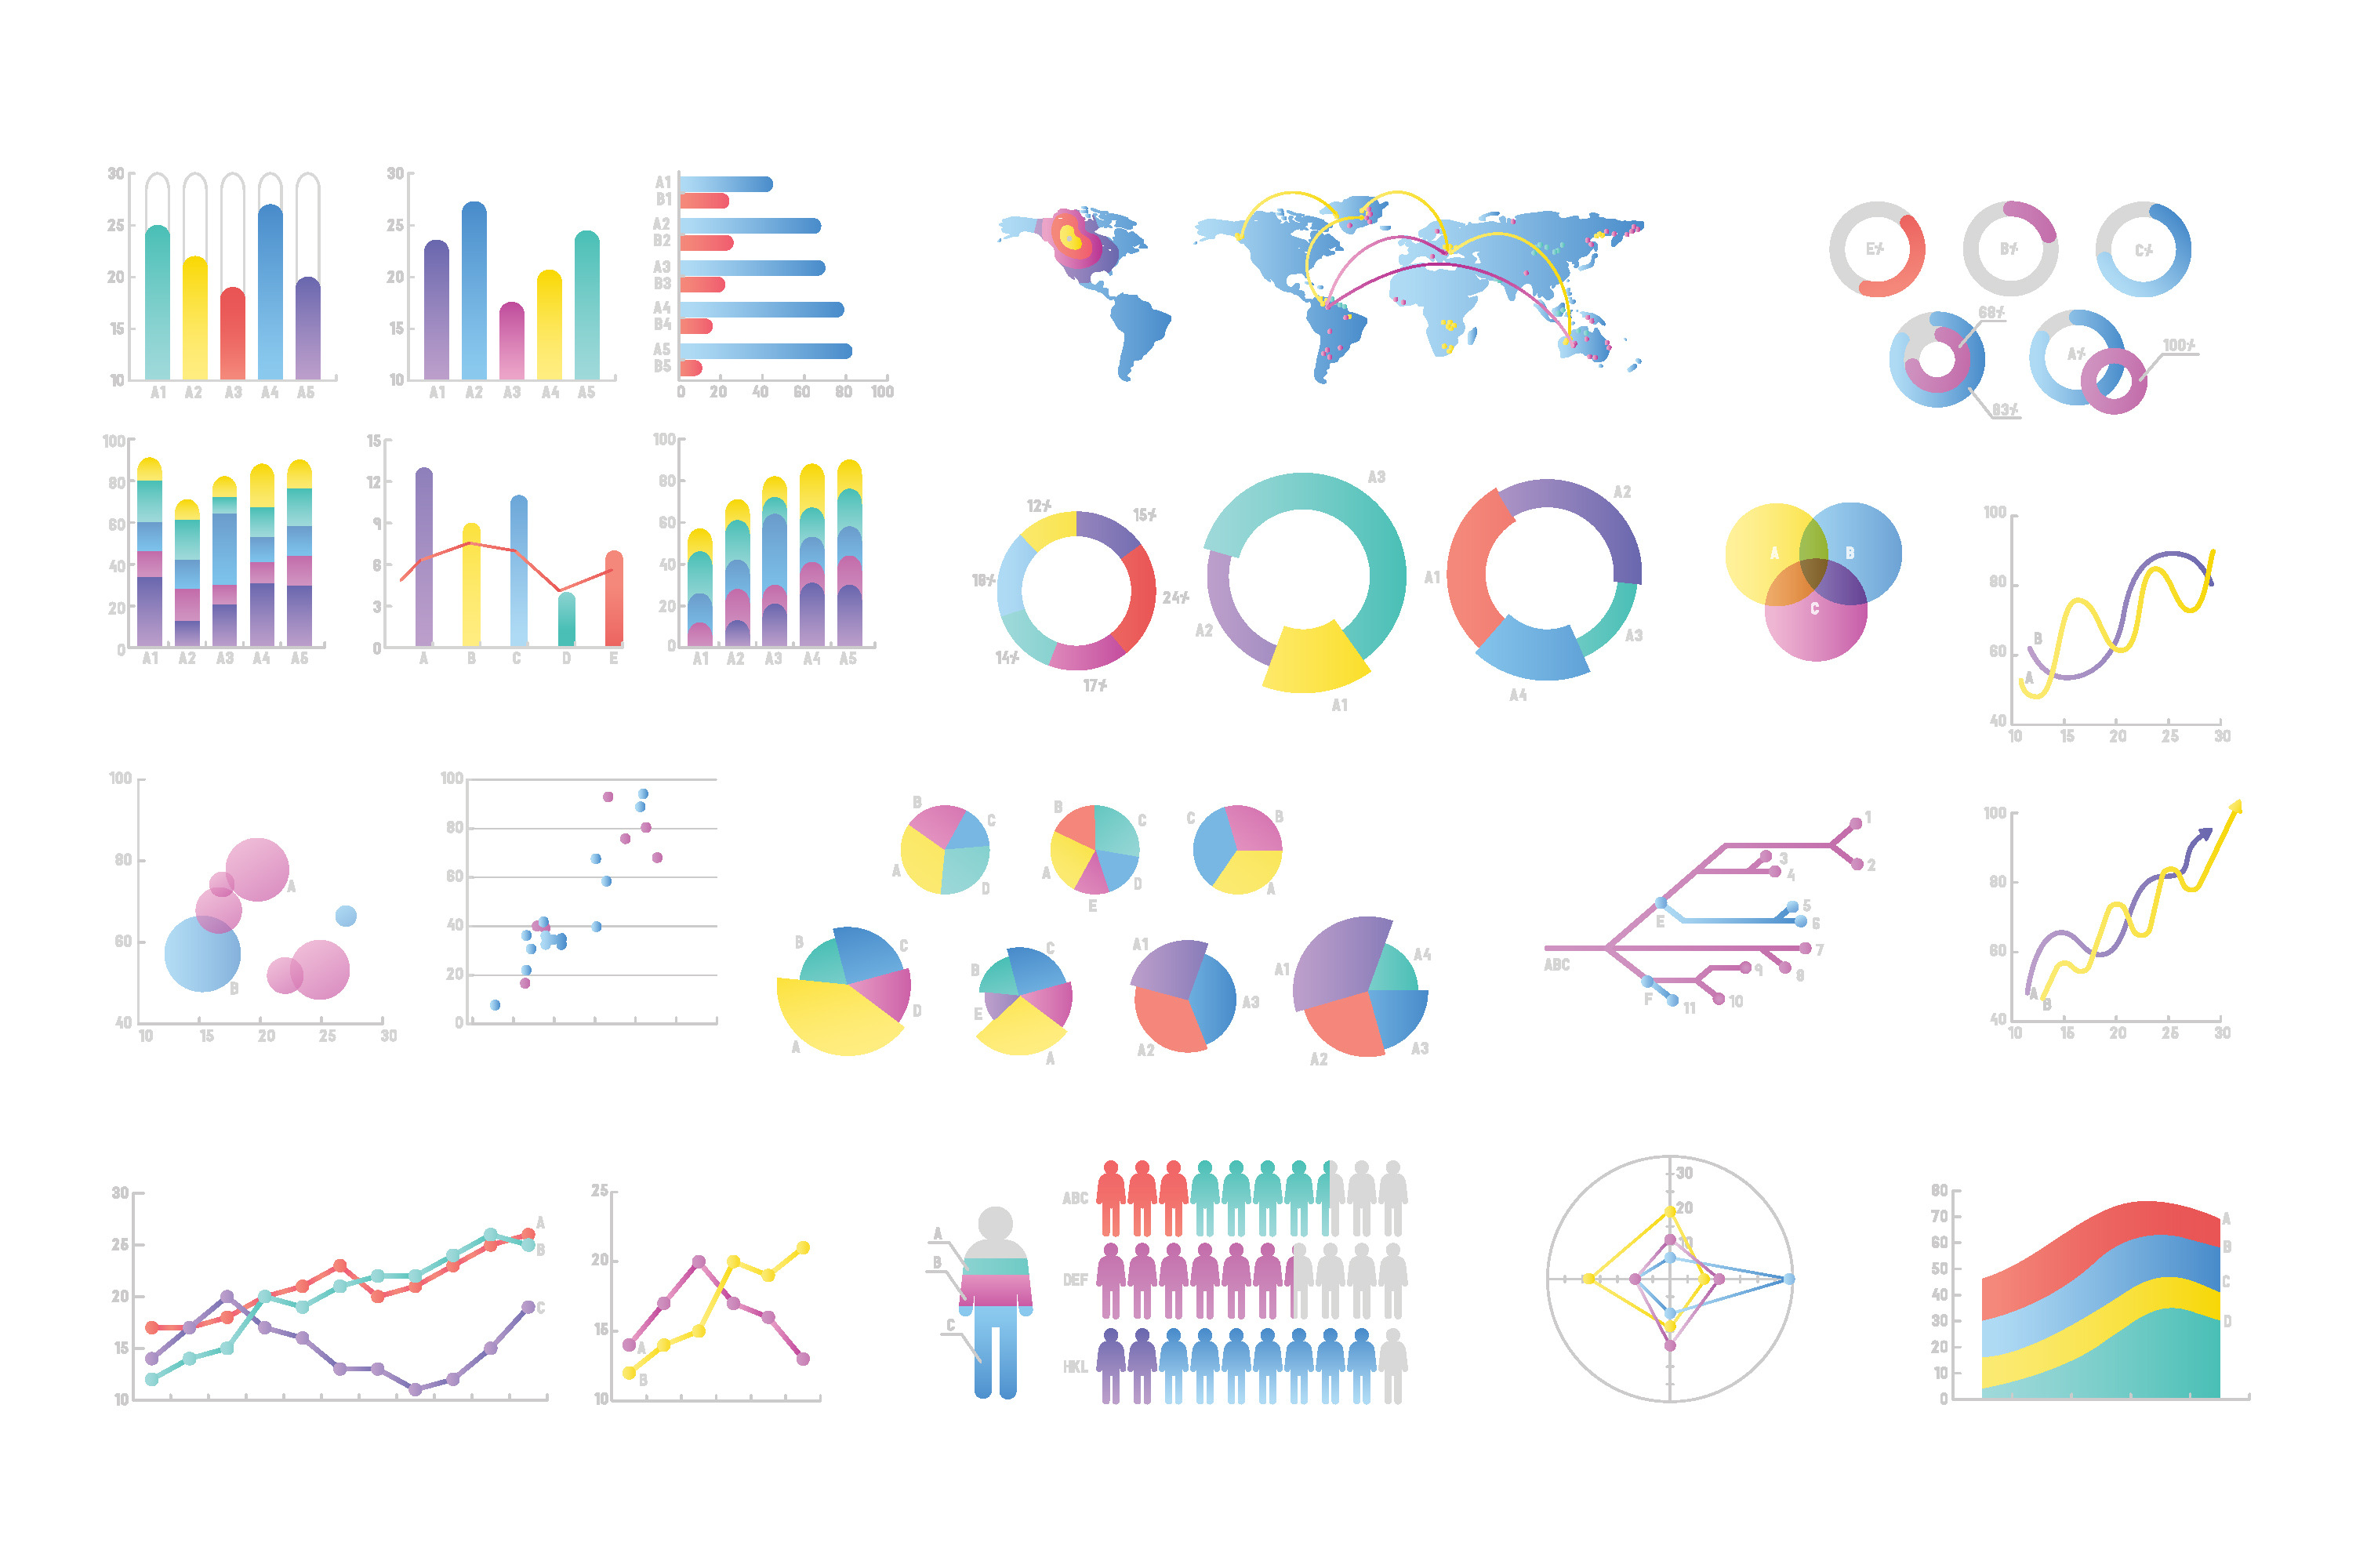
Charts and diagrams
DOWNLOAD NOW Report
128
0
YOU MAY ALSO LIKE:


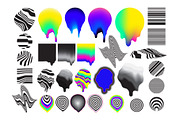
**Colorful collection of various elements for data presentation and infographics. Charts and diagrams to show statistics or visualize numerical information.** Vector elements in flat style.
To modify the files in the set, use vector editors (such as Adobe illustrator, Corel Draw, etc.). To work with raster editors (such as Photoshop), use PNG files with a transparent background that are stored in the archive.
---
**Zip file contains:**
- 1 vector EPS10 file;
- vector AI CS5 file;
- 29 PNG files on transparent background, each chart or diagram separately;
- 1 JPEG file (6285x3977 px, 300 dpi).
| Compatible with: | Adobe Illustrator, Adobe Photoshop |
| File Type: | PNG, JPG, EPS, AI |
| File Size: | 7.86 MB |